Cause and effect diagrams, also known as Ishikawa diagrams, are one of 7 basic tools of quality. You won’t see them used very often in software development or IT projects though they should be. So today we’re going through what cause and effect diagrams are, why they’re useful, an example diagram, and case studies.
What is a Cause and Effect Diagram?
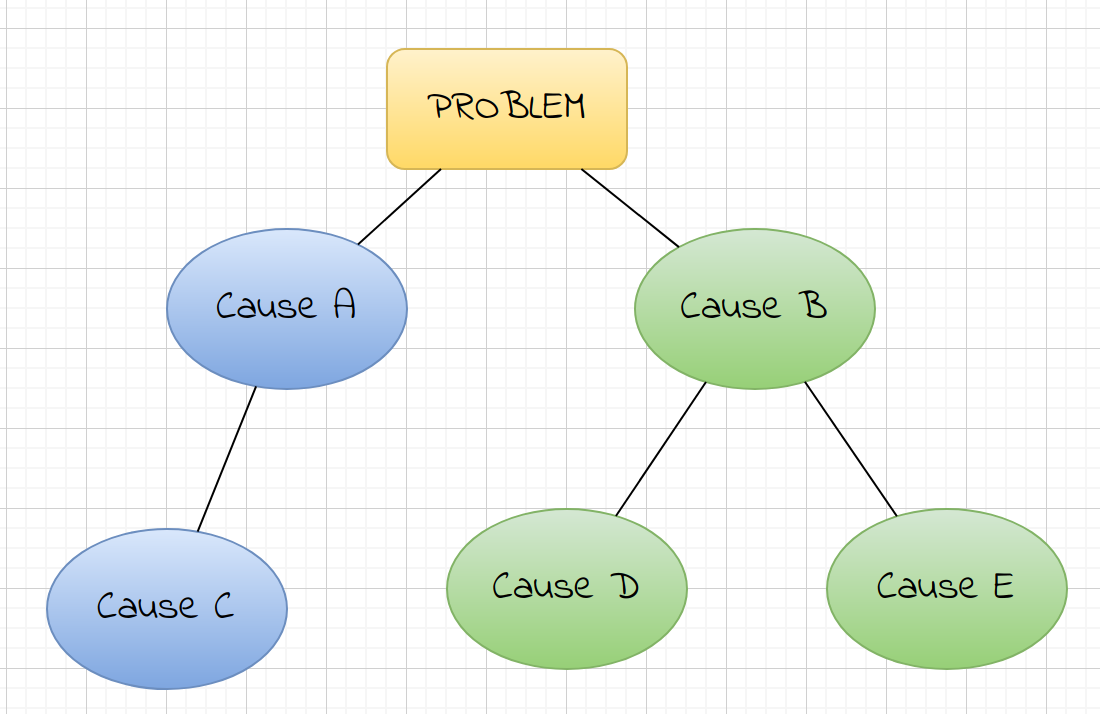
A cause and effect diagram is drawn by starting with the effect that is being produced. This could be a bug or a problem or some other issue with the software or IT project.
Then the individual or, preferably, the team comes up with possible causes. This list of causes is investigated, one at a time, and sub-causes are determined.
If there are no sub-causes, then it’s likely that this wasn’t the actual cause of the effect. If there are sub-causes, and sub-sub-causes, then you’re on the right track and will find the actual cause of the effect.
Why are Cause & Effect Diagrams Also Known as Ishikawa Diagrams?
Kaoru Ishikawa created the concept of the cause and effect diagram in the book “Guide to Quality Control”. The book was first published in 1968 and republished in the 1970s and 1980s.
Dr. Ishikawa wrote a few books on quality control and Ishikawa/Cause & Effect diagrams are part of them.
The book “Guide to Quality Control” features more than the cause & effect diagram. The book also features control charts, histograms, scatter diagrams, check sheets and Pareto diagrams.
Usefulness of Cause and Effect Diagrams
Cause and effect diagrams are useful because they let you list out all the causes that you and/or your team can think of.
When investigating a problem, people will usually start with one or two causes and investigate those causes. Then they will think up more potential causes if those first few causes were not at the root of the effect and try to investigate those. In other words, they start with A and B, investigate those and then move on to investigate C and D. This approach works.
However, it is not as effective as the cause and effect diagram approach because it is not systematic and it does not outline common causes that should be investigated. The simplistic approach can mean wasted time and energy when the causes aren’t the root cause of the effect. In an IT environment or software development project, it can mean debugging for hours and getting no closer to a solution.
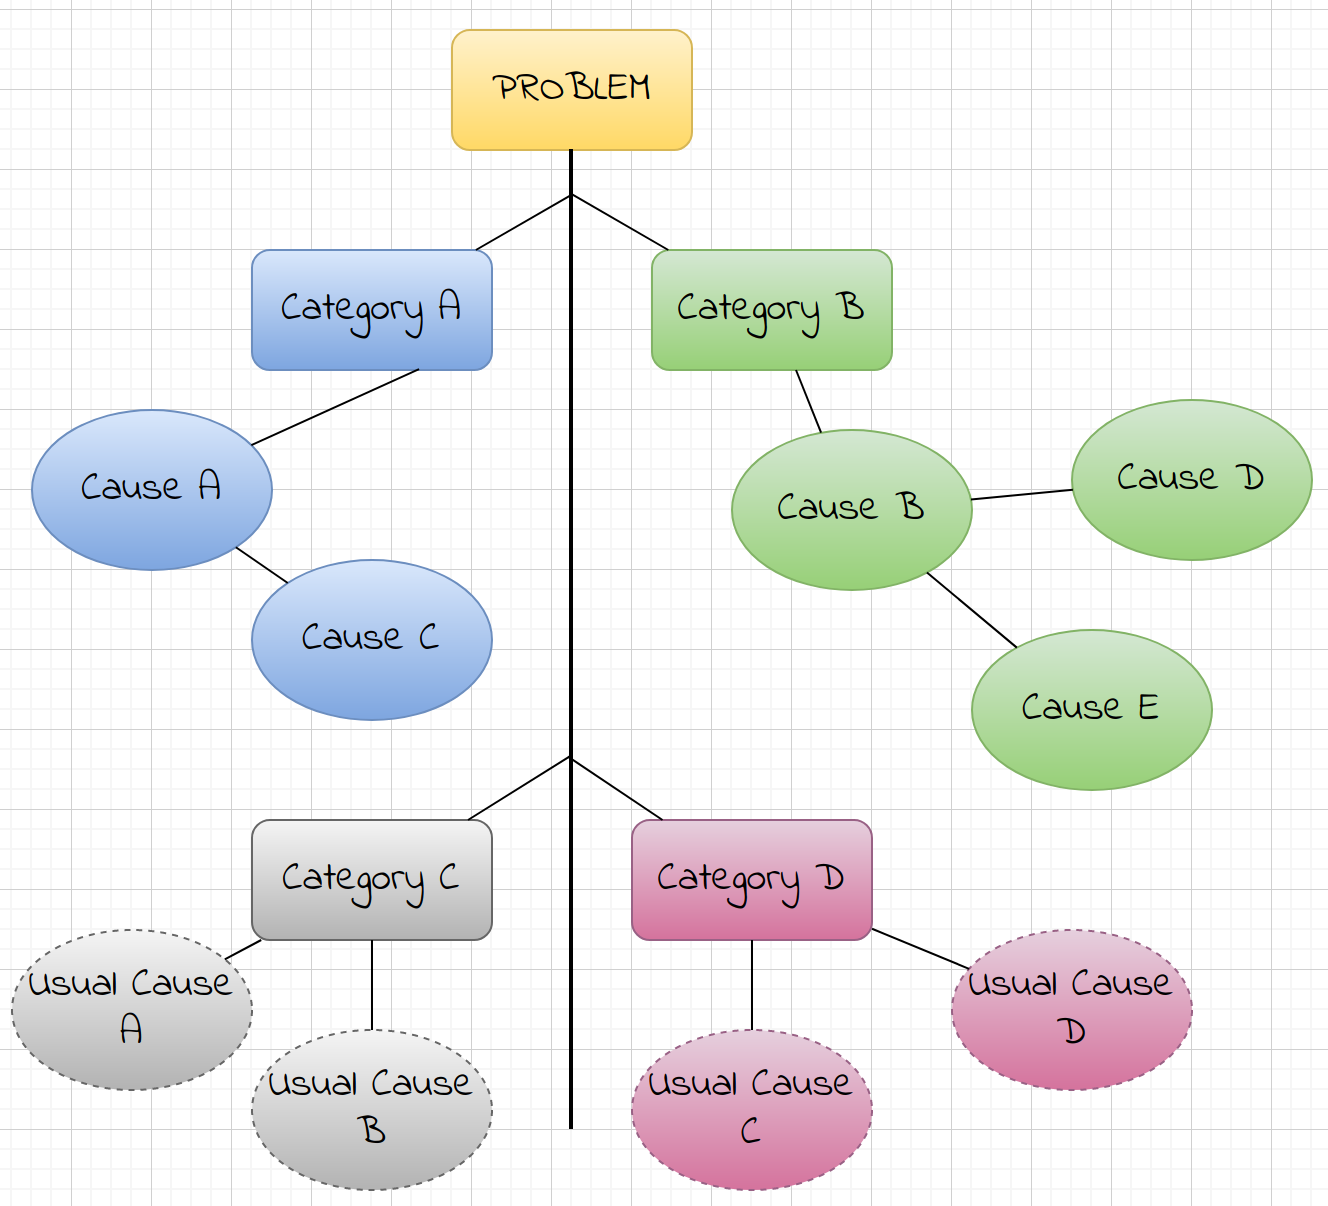
In contrast, by stepping back and thinking of categories of potential causes and walking down each potential cause as they are investigated, you can narrow down the root cause much sooner. As an additional benefit, you can share this with other stakeholders on the project to keep them informed of the status and progress of an investigation.
Peer Review of Causes
Having a team think of possible causes is similar to the concept of peer review in software development projects. Where one person thinks of a few causes, another person will think of different causes. This gives a broader range of causes to investigate. Some of the causes can be eliminated as other team members may have already investigated them and found them to be dead-ends.
Listing causes together as a team can be a great exercise in collaboration.
Creating a History of Causes and Effects
If cause and effect diagrams are stored in the organizational knowledge base, they can help in the future.
If an effect sounds similar to another one, such as two bugs in the same component, the causes could be similar as well. Being able to search through previous cause & effect diagrams when a problem comes up may make it faster to solve the problem.
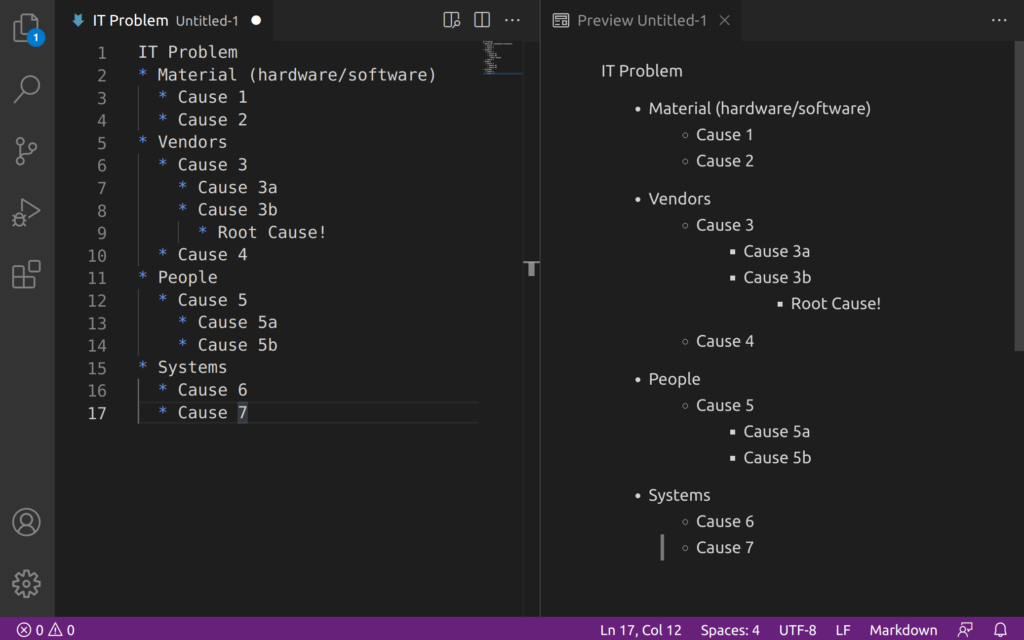
Cause and Effect Diagrams in Markdown or Plain Text
If you are in the tech industry, it is more common to store plain text or Markdown files and text-based formats are easier to search through and can be kept in a version control system.

Common Causes in the Marketing, Services, and Manufacturing Industries
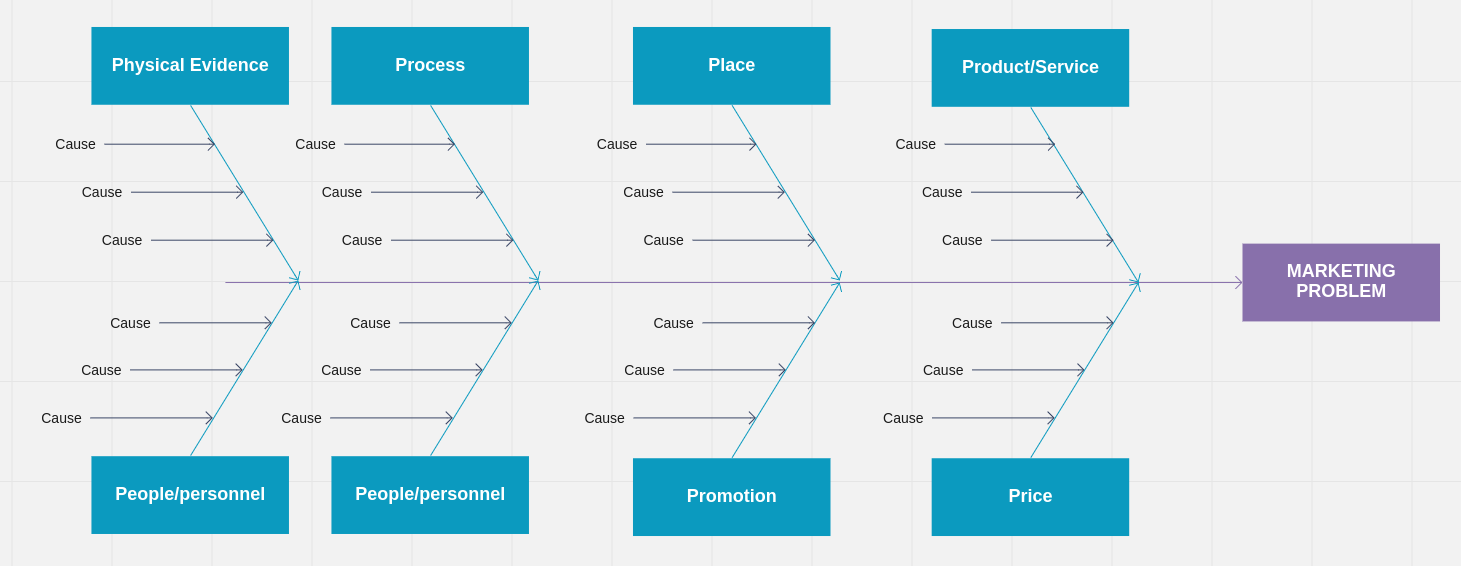
Marketing Common Causes
In the marketing industry it is common to start with a set of common causes (8 P’s):
- Product/Service
- Price
- Place
- Promotion
- People/personnel
- Process
- Physical Evidence
- Publicity
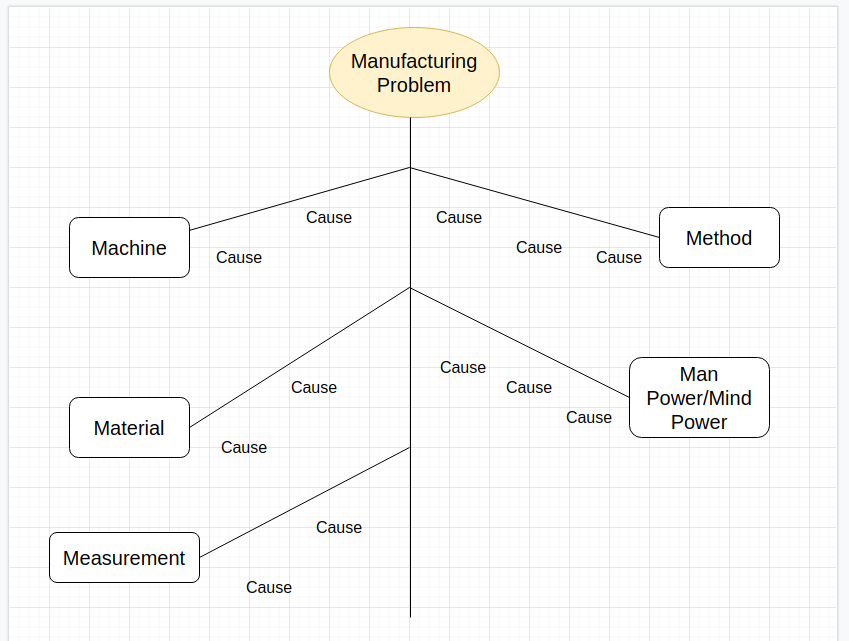
Manufacturing Common Causes
In the manufacturing industry, they start with these causes (5 M’s):
- Machine
- Method
- Material
- Man Power/Mind Power
- Measurement
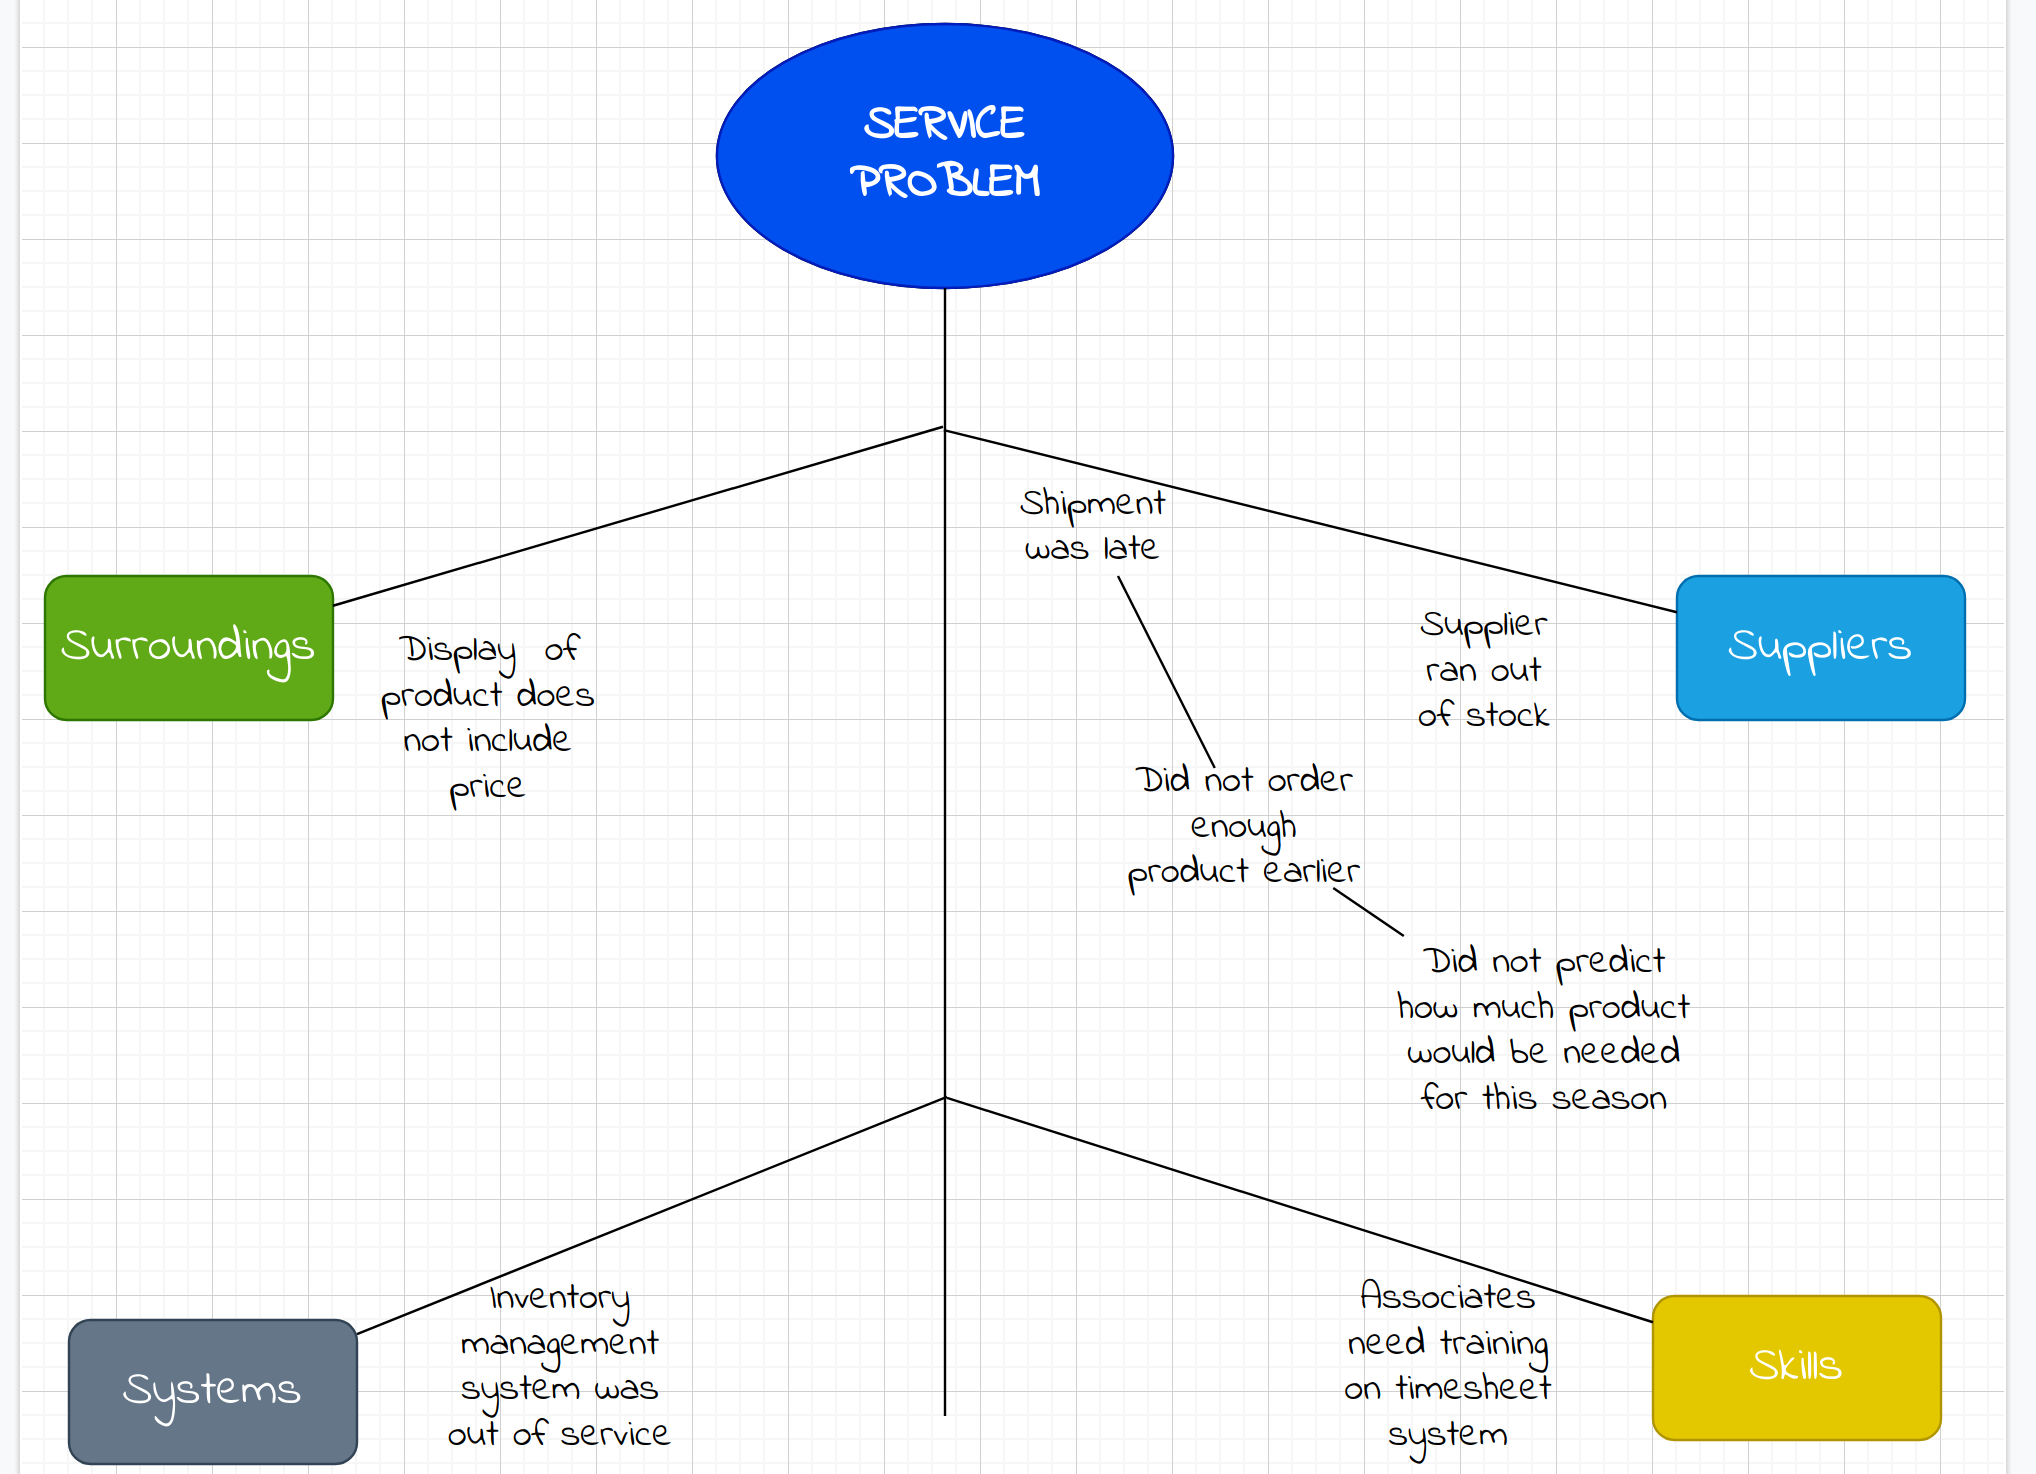
Service Industry Common Causes
In the service industry it’s common to start with these causes (4 S’s):
- Surroundings
- Suppliers
- Systems
- Skills
Common Causes in the IT and Software Development Industries
In the IT and software development industries, a list of common causes has not been developed. So the following is my attempt at creating the list of common causes when investigating problems in the IT and software development industries.
The common causes are MVPS for IT and MCPS for software development. They focus on the key causes such as Vendors or Code that are highly likely to be the cause of issues. They are compact (there’s only 4 of them, each) and a quick way to get started with using cause and effect diagrams.
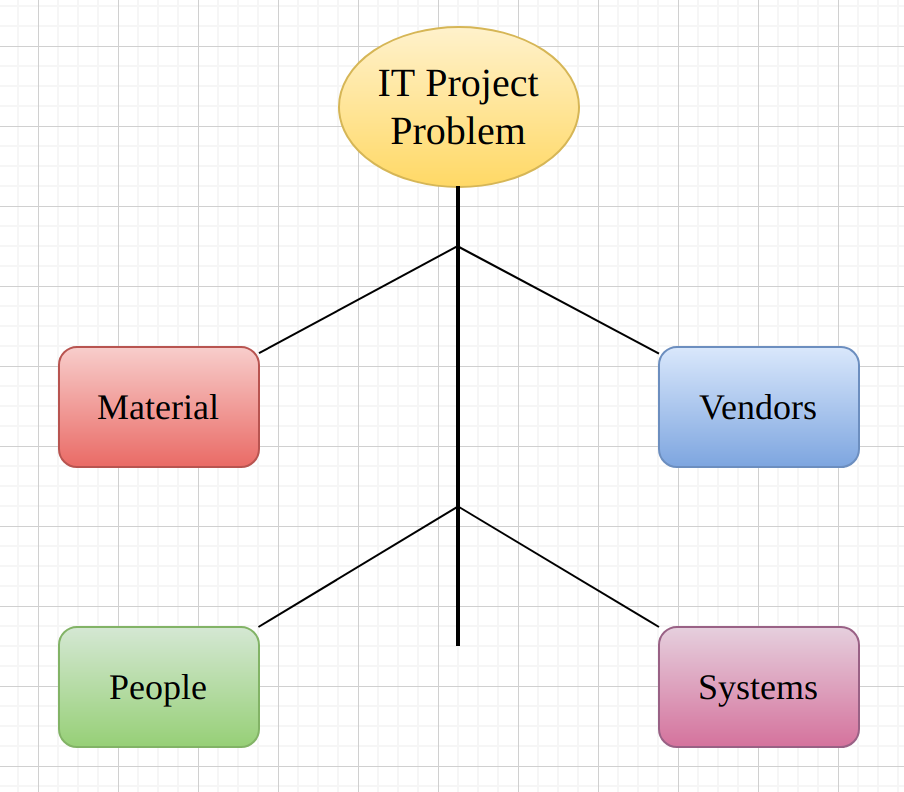
MVPS: IT Project Causes
On IT projects these are good starting points for causes (MVPS):
- Material (includes hardware and software)
- Vendors (such as hardware/software vendors)
- People (your team members, coworkers and other stakeholders)
- Systems (used to control and manage IT functions)
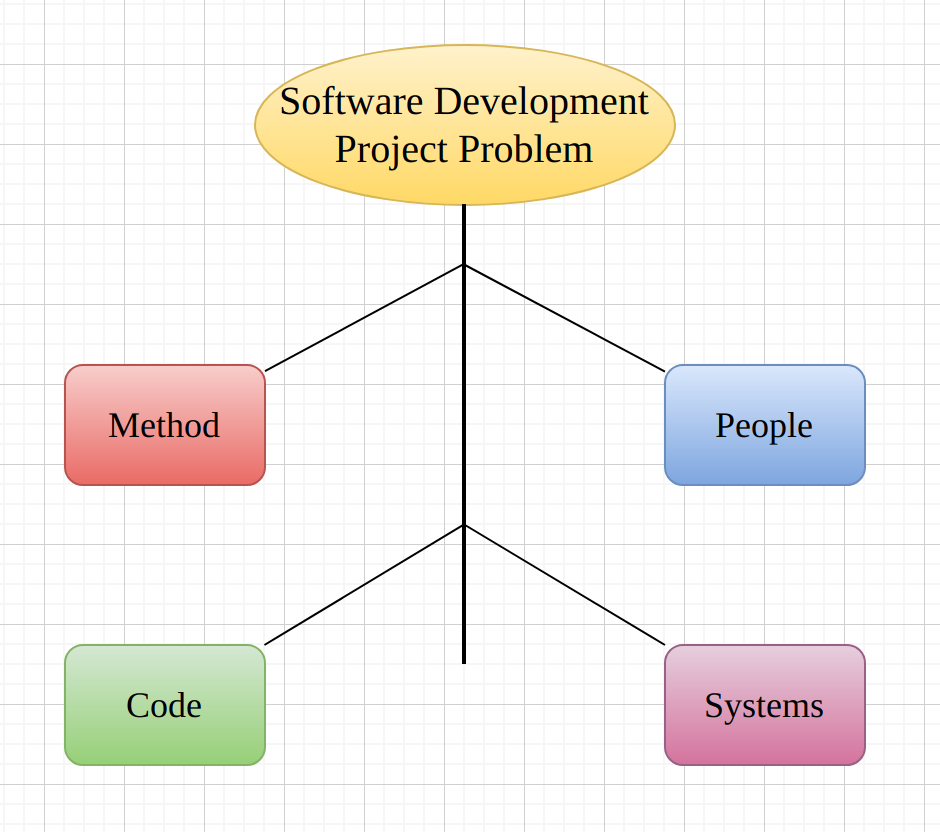
MCPS: Software Development Project Causes
For software development projects, this set of common causes is solid foundation to investigate (MCPS):
- Method (include software development life-cycle, QA process, agile methodology, SCRUM methodology, Waterfall)
- Code (the source code and related artifacts such as packages and libraries and frameworks)
- People (your team members, coworkers and other stakeholders)
- Systems (the systems used for development, releases, deployments, testing)
Case Studies
When I wear my software developer hat and work on IT projects, I sometimes have to search for the cause of a bug in the software and fix it.
This requires using a root cause analysis to first find all the issues contributing to causing the bug. Then fixing them all either by writing more code, writing more tests, or by changing the design of the software.
However, before I can determine the cause and fix it, I have to figure out what the possible causes are.
By using a cause and effect diagram, I can list out as many potential causes as I can think of. Then I can investigate each potential cause and eliminate them until I get to the real cause (or causes). It may sound tedious but it’s the only way to be sure that some causes were not prematurely eliminated.
We use the MVPS (Material, Vendors, People, Systems) and MCPS (Method, Code, People, Systems) common cause categories as starting points in these case studies.
Low Developer Velocity: Causes and Effects
The following is a cause and effect diagram where the problem is low developer velocity.
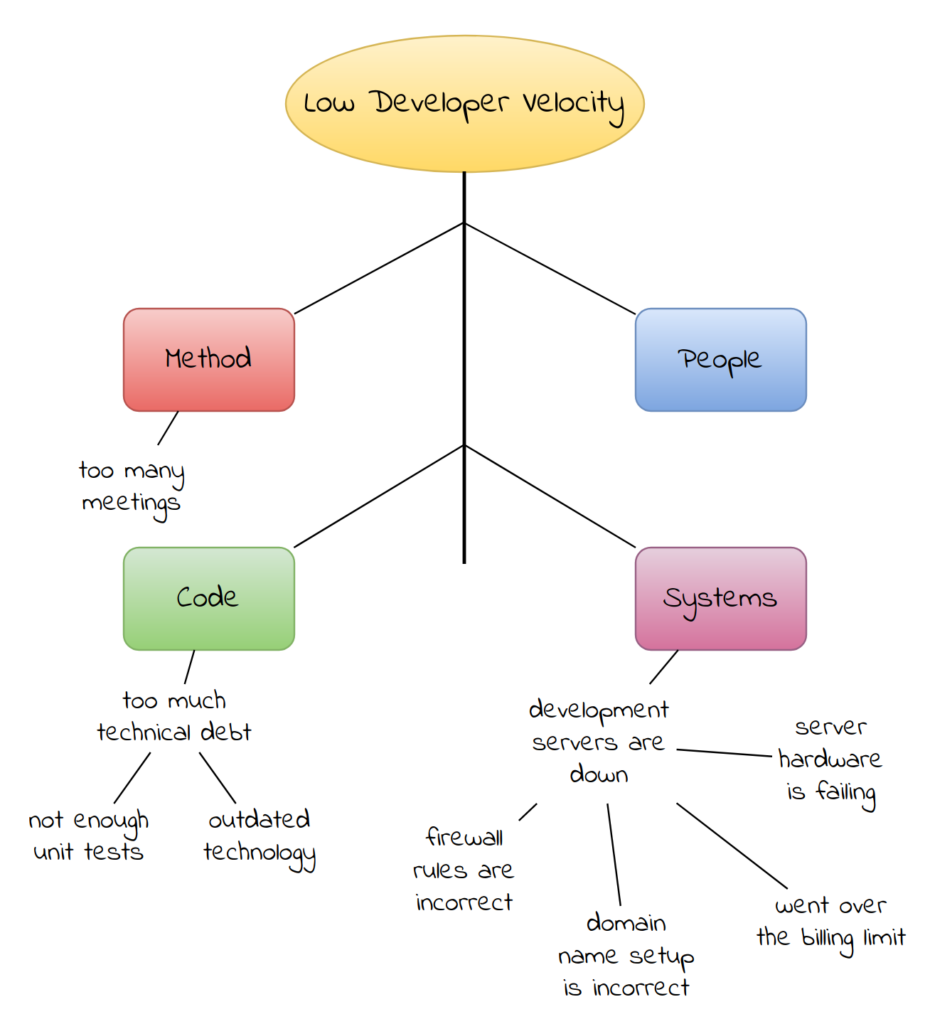
The software development team as a whole is taking longer to ship working software. By using MCPS (Method-Code-People-Systems) as the starting causes we can dive deeper into the sub-causes.
Do remember that the causes are possible causes. Some of them are not causing the problem. In other cases, the causes are contributing but can be ignored because they are low risk for the project.
Every software development project is different and each problem can have one or many causes.
Exploring and Drilling Down into Sub-Causes
Sub-Cause Exploration: Development Servers Are Down
Let’s say we are exploring the “Development servers are down” cause under the Systems cause. We could split that further into checking whether the problem is with the internet connection to the servers, the firewall rules, domain name issues, hardware problems, billing issues, and so on.
Before we investigate those potential causes of the development servers being down, we first check if they are in fact down. If the development servers are up, we can eliminate this from the list of causes of low developer velocity.
Sub-Cause Exploration: Too Many Meetings
“Too many meetings” can be a real issue for mid-to-large sized companies and for enterprises. Checking the work calendars of coworkers, team members, and other stakeholders can quickly determine whether “too many meetings” is the cause of low developer velocity.
If everything is going right, many of the potential causes will be eliminated and you will quickly narrow things down to a few causes. Investigate and document them thoroughly and you will be prepared for future issues that are similar.
Sub-Cause Exploration: Too Much Technical Debt
For a startup, “too much technical debt” could be the root cause of many software development problems. At first, the velocity of the team in a startup will be high but as the startup grows, the technical debt will catch up to the team and slow them down.
Eliminating technical debt should always be a priority, but when trying to improve velocity, a more nuanced approach is required. What are the potential causes of technical debt? Moving too fast, poor architecture decisions, outdated technology, little or no testing, and so on. Again, most of these potential causes will be eliminated as causes of low developer velocity.
Server Procurement Takes Too Long: Causes and Effects
It can take too much time to procure a server. This is a common I.T. issue for organizations that are not using cloud server infrastructure. In rare cases, this problem also exists in cloud-using organizations but it is very rare (and mostly a matter of giving the right authorization/permission to the I.T., devops and development teams).
In the following diagram we start with the MVPS (Material-Vendors-People-Systems) causes since this is an I.T. issue. The potential sub-causes will be different for different organizations but you should notice a few that exist in your organization if you are not using cloud-based server infrastructure.
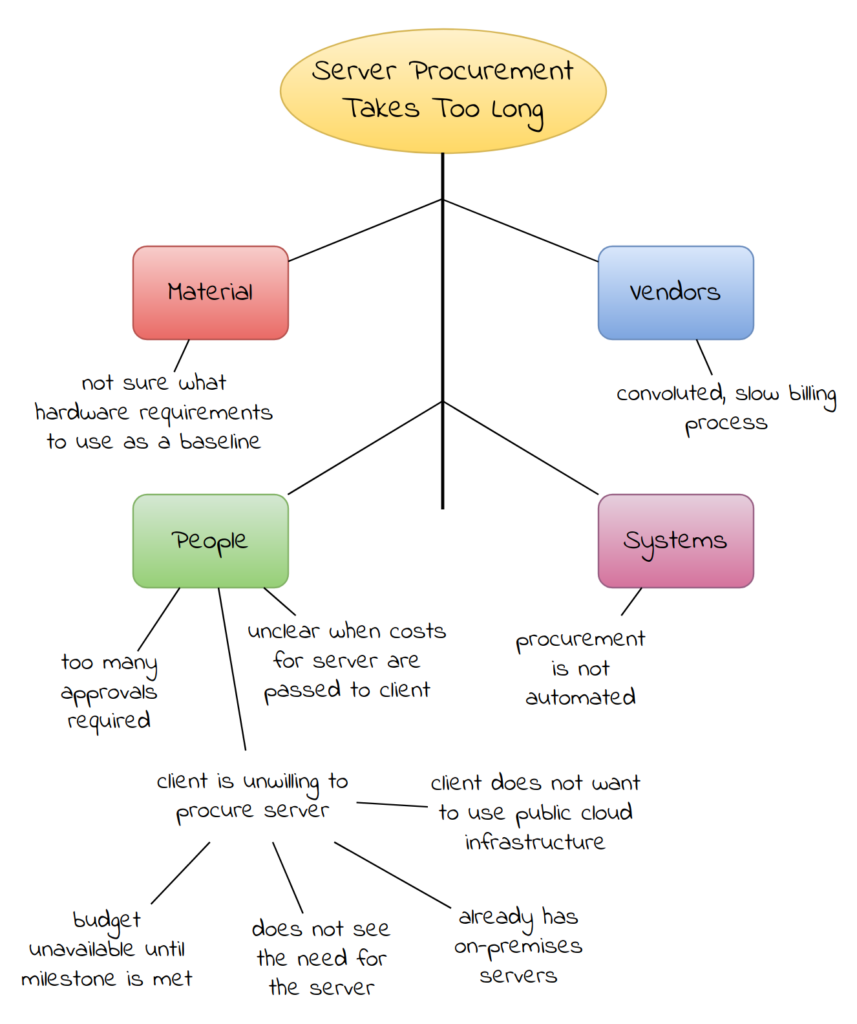
Let’s take a look at some of the potential causes. Procurement is not automated will typically be the cause in non-cloud organizations. In places where procurement is automated, server procurement time drops dramatically. In one case I’ve seen a 3-week procurement time drop to 2 days.
Sub-Cause Exploration
In a development agency, server procurement may take too long because the vendor’s billing process is convoluted or because clients do not want to pay for the server yet or because many approvals are required for procurement. For example, procurement approval could require project manager, account manager, IT and client sign-off because it affects the work schedule and what and when the client is billed.
Drilling Down Into More Sub-Causes
Let’s say that “client is not willing to procure the server yet” is an extremely likely cause of our problem.
What are the causes of this? Let’s drill down and figure out some more sub-causes.
- The client may not have budget for the server until after a certain date or project milestone
- The client is unsure of the success of the project and whether it will be launched and may not need the server at all
- The client is not technical and does not see the need for a server yet
- The client already has their own servers
- The client does not want to use our private cloud infrastructure
- The client does not want to use public cloud infrastructure
- The client wants to build their own server infrastructure
- The client wants to determine all the hardware/software specifications of the server which takes time
We could go on and on and in a real-world scenario, your team can brainstorm more causes and work together on eliminating these potential causes as the source of slow server procurement.
Applying Cause and Effect Diagrams
As the IT and software development industries mature, you will see more and more quality control tools used. Cause and effect diagrams are the best first step to using other quality control tools since determining and fixing the causes of problem effects are something that developers, devops and IT teams do on a regular basis.
The MVPS (Material-Vendors-People-Systems) common causes for IT projects and the MCPS (Method-Code-People-Systems) common causes for software development will cover many of the causes of problems in the IT and software development industries.
MVPS and MCPS can be used to introduce the cause-and-effect diagram tool to the IT or software development team. Using a cause and effect diagram will have an immediate positive impact on productivity and increase organizational knowledge in order to prevent further issues.
Cause & Effect Diagramming Tools
You can create cause & effect diagrams (also known as fishbone diagrams) in any diagramming software that supports boxes and lines, you can create them in LibreOffice or PowerPoint or with online tools like Diagram.net and Miro.
Here’s how you can create a cause and effect diagram from a template using Miro:
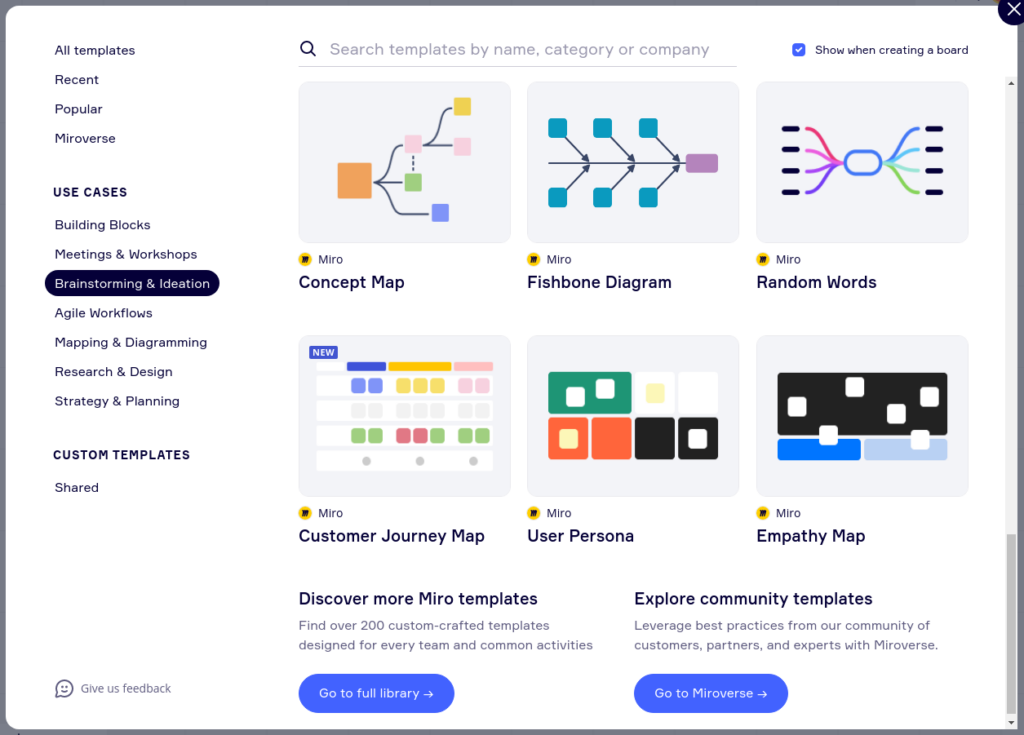
And here’s how the template will look like in the Miro user interface:
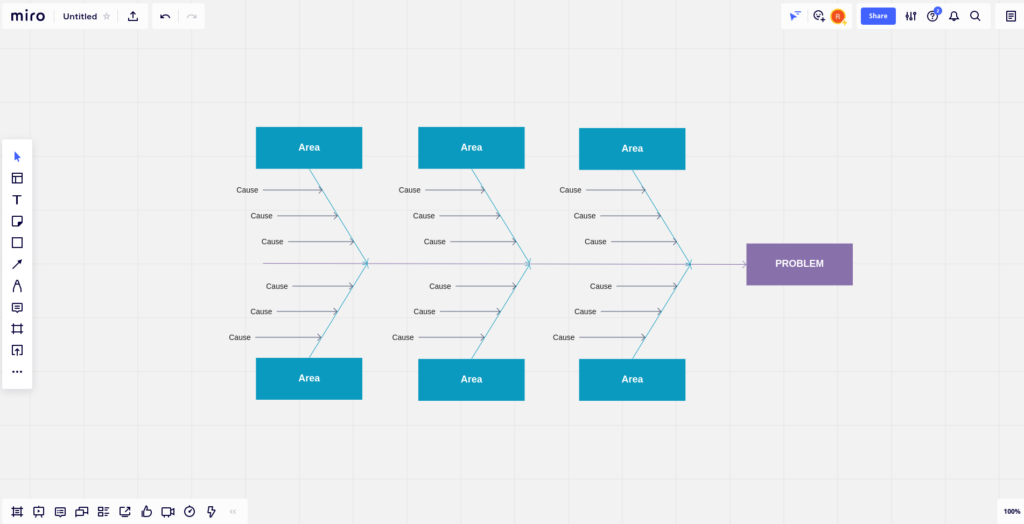
From there you can change the text to match the concepts that you want to explore as the causes and effects for a particular situation.
You can create cause and effect diagrams using a text editor using plain text or Markdown: