Initially, this was going to be an article on how to use specific tools for an AI data pipeline and how to train a particular machine-learning model. However, the concepts of data engineering and the data pipeline are essential. While some of the tools will be used across projects and companies, many will not, so it is good to have a high-level understanding and be able to use whatever tools are available.
Data Pipeline for Product Analytics
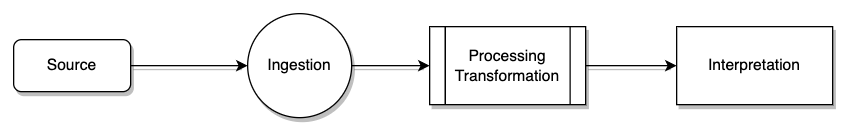
There are three parts to a data pipeline for analytics: ingestion, processing/transformation, and interpretation. For analytics, many of the tools encapsulate this data pipeline. For ingestion of data, you need data sources. Google Analytics GameAnalytics or Mixpanel SDKs and implement event tracking in various places (web server, web app, mobile app, game, command-line tool). As the data is gathered, it is processed in a variety of ways; for instance, Mixpanel shows the cohorts and Google Analytics parses the web browser versions used to access a website. The interpretation step is all the dashboards, charts, and graphs that the analytics tools provide.
The data pipeline becomes a feedback loop: the data points collected become part of evaluating new and existing features for the product roadmap; new features need new event tracking created so the feature can be evaluated.
Adding a layer of sophistication, your data pipeline grows, and additional customization in the processing/transformation step becomes necessary, or the skillset and workflow of your data science team are based on generating and interpreting SQL reports.
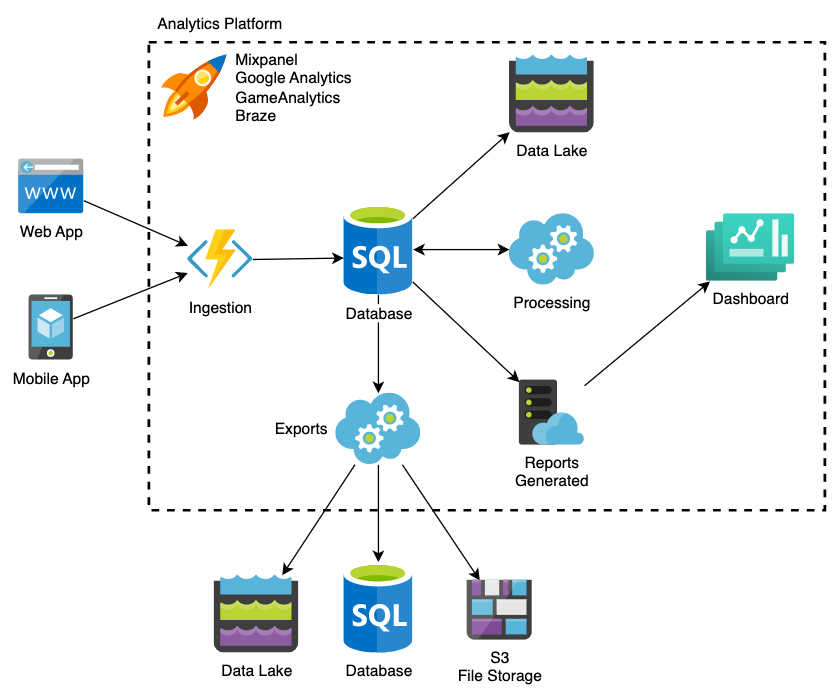
Suppose you are happy with some of the processing and transformations. In that case, you can keep using whatever analytics tool you have and export the data to ingest it into a system that supports SQL queries.
Data Pipeline for AI and Machine Learning
For AI and machine learning, the data pipeline consists of four parts: ingestion, processing/transformation, training, and prediction. For AI/ML, ingestion consists of two key pieces: the data used for the initial training set and the feedback used for further training. The processing/transformation part transforms the events into training data. Then, the model is trained, tested, and revised in an iterative process. When it is deployed, it will respond with predictions. It can be trained further with feedback from customers, users, or other datasets.
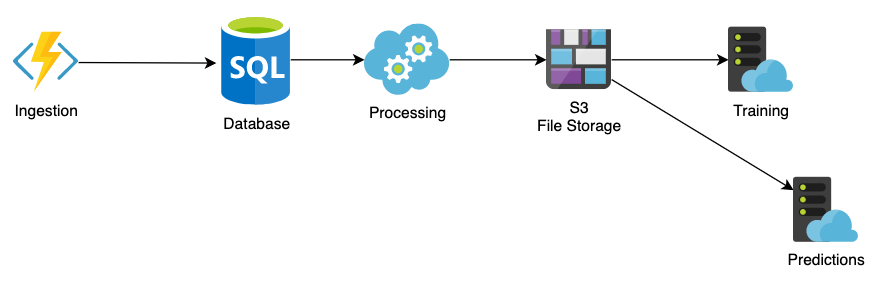
Search engines and search results ranking are excellent examples of the pipeline. The data ingested are web pages; the processing/transformation extracts the title and keywords of the web pages and the number of clicks. The training uses that dataset, and then predictions are made. The feedback for search results can be measured in increased clicks for better results.
A crucial difference between the data pipeline for analytics and AI/ML is that the processing and transformation stages can include data labeling by humans or other synthetic data for training. For example, suppose you are training a programming ML model based on Python source code. In that case, you can supplement actual code bases with synthetic code that replaces variable names. Another example is image labeling or search results labeling, categorizing the image containing cats or dogs, and classifying the search results if they are irrelevant.
Data Pipeline for LLMs (Large Language Models), GPT-3, GPT-4, ChatGPT
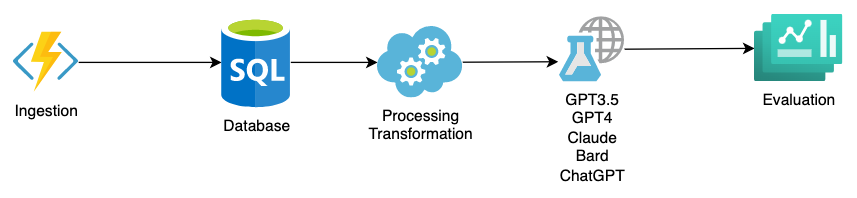
The data pipeline for large language models or any pre-trained model such as GPT-3.5 and GPT-4 has the following steps: ingestion, processing / transformation, and evaluation. The processing step is to set up and recall context and the prompt for the large language model. The training and prediction steps that other AI/ML data pipelines have is skipped since large language models function differently. Fine-tuning does not change this either.
For example, if we are building a financial statements classification AI model using GPT-4 or ChatGPT, we would ingest the financial statements and transform them into a table with additional context such as the list of categories and then get a result. The result is then evaluated and the prompt is updated or continued.
Since pre-trained LLMs are accessed through external APIs, monitoring the response times and availability of them and monitoring any changes made to models is highly important. LLMs that are not built in-house can drastically change between models and prompts and contexts need to be evaluated constantly.
Data Pipelines are Everywhere
The most common data pipeline that software engineers will encounter is error tracking. Whenever an error occurs in their application, the error with contextual data and a stack trace are sent to an error monitoring tool. That tool, such as Sentry or BugSnag, will process and transform that data so that it can be interpreted. The tool encapsulates the data pipeline and the main focus becomes interpreting the data.
Another common data pipeline for software engineers is observability and logging through Splunk or Honeycomb or Datadog. With auto-instrumentation, the baseline of data ingested is great and the initial focus can be on interpreting data. However, more data will be needed to monitor the health of the system, that data could be annotations of when there was a release or deploy, or additional context about a request or database query. The focus is an iterative process of interpreting data and updating the ingested data to better understand and monitor the system.
For startups and public companies and businesses everywhere, the most important data pipeline is the revenue and expenses. The data can come from bank accounts or PayPal or Stripe, it’s processed and transformed into an income statement in QuickBooks or Xero or another accounting tool and then interpreted at different levels of time (daily, monthly, yearly). When the financial data pipeline is working smoothly, interpreting the data is the primary focus. When the pipeline is being set up, the main focus is on the ingestion of the data. Sometimes there can be issues in the processing/transformation step, for example double-counting or excluding items that should have been included. The tools that are used for this pipeline all have APIs so that they can at the beginning of a customized data pipeline, for instance include flagging large expenses for review or sharing large sales for celebrations.
Building a Customized Data Pipeline
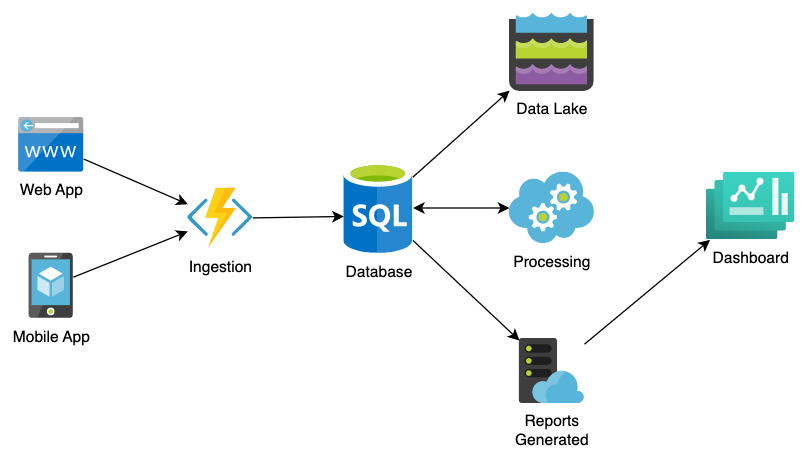
At a high-level, to build a data pipeline you will need a way to receive data, an ETL (extract, transform, load) to process/transform it, and then a way to view the results for interpretation.
The simplest customized data pipeline consists of a web server and a database. Using Ruby on Rails or Django, you can ingest data with one endpoint, transform it in a background process, and then store the data in a database. On another endpoint, you can display charts based on that data. Make sure to keep an eye on how much data is generated and consider retaining it for a short period of time. Some other options for limiting the amount of data generated are: aggregating it as part of the transformation step, or archiving it to cold storage (such as S3 or Glacier).
With this as a starting point, you can improve each part of the pipeline.
For instance, you can improve the data ingestion and make it scalable by running it as a separate web service with auto-scaling. More users means more requests to the ingestion endpoint means more writes to the database.
To improve the interpretation part of the pipeline, you can upgrade the database with more read replicas and switch your web app to use those for reading the data and displaying it. At a certain scale, you can batch those writes in asynchronous background distributed tasks. This can improve data ingestion and improve the processing/transformation parts of the pipeline.
If you’re interpreting data on a weekly basis, you can improve the processing/transformation part of the pipeline by aggregating the data for each week ahead of time, acting as an index for the data interpretation.
At the other end of the scale, at enterprise scale, you will need a data warehouse and you will have many sources of data being ingested and transformed. Tools such as Looker and Tableau can use the data warehouse and display charts for interpretation of the data.